Here’s What History Says About Stock Market Returns When Republicans Win.
Spring has officially sprung — and so has election season.
In seven months, Americans will head to the polls to determine who’ll lead the United States over the next four years. While there are plenty of avenues to politics that don’t intersect with investing, the fiscal policy changes signed into law by the president of the United States can impact everything from corporate earnings to the U.S. economy.
Sporting nearly 1,700 delegates as of this writing, former President Donald Trump is the presumptive nominee for president from the Republican Party. During Trump’s presidency, from when he was sworn in on Jan. 20, 2017, through his departure from the White House on Jan. 20, 2021, the ageless Dow Jones Industrial Average (DJINDICES: ^DJI), broad-based S&P 500 (SNPINDEX: ^GSPC), and growth-fueled Nasdaq Composite (NASDAQINDEX: ^IXIC) respectively gained 57%, 70%, and 142%!
But could a second term for Donald Trump sends stocks off a proverbial cliff? Let’s have a closer look at the challenges that would await a Trump presidency and let history have the final say.

Are stocks going to crash if Donald Trump wins in November?
The potential downside catalysts for a Trump victory would take on two forms:
- Macroeconomic catalysts that persist regardless of who wins in November.
- Policy specific changes proposed by Trump that could adversely impact the U.S. economy and/or corporate earnings.
Last week, I took a closer look at some of proposals the presumptive presidential nominee from the Democratic Party, incumbent Joe Biden, has offered that could knock the Dow, S&P 500, and Nasdaq from their all-time highs. These include a suggested quadrupling of the share buyback tax to 4%, as well as increase in the alternative minimum corporate tax rate and peak corporate tax rate. These actions have the potential to make reinvestment, hiring, and acquisitions less attractive to businesses, all while slowing earnings growth in an already pricey market.
For Donald Trump, there’s one glaring policy proposal that could leave corporate America and investors skittish.
In early February, Trump noted in an interview on Fox News’s “Sunday Morning Futures” that he plans to institute a tariff on imported Chinese goods of up to 60% if he wins a second term. During Trump’s first term, tariffs implemented on Chinese goods led to higher prices for consumers and a strained relationship with the world’s No. 2 economy by gross domestic product. Higher costs for consumers could tip the U.S. economy into a recession.
But as noted, there are headwinds that could topple the Dow, S&P 500, and Nasdaq Composite regardless of whether it’s Donald Trump or Joe Biden at the helm come January 2025.
As an example, M2 money supply has fallen by more than 4% since hitting an all-time high in July 2022. M2 money supply takes into account everything in M1 — cash and coins in circulation, along with demand deposits in a checking account — and adds in money market accounts, savings accounts, and certificates of deposit (CDs) below $100,000.
While it is possible the more than 4% retracement in M2 money supply is simply a reversion to the mean after a historic expansion of the U.S. money supply during the COVID-19 pandemic, history has shown that notable declines in M2 spell trouble.
Last year, Reventure Consulting CEO Nick Gerli back-tested year-over-year changes in M2 money supply to 1870 and found only five instances, including the present, where M2 had fallen by at least 2%. The previous four instances (1878, 1893, 1921, and 1931-1933) all coincided with deflationary depressions and high unemployment.
To be fair, the nation’s central bank didn’t exist in 1878 or 1893, and the knowledge the Fed and federal government now have makes it highly unlikely that a depression would take place. Nevertheless, declining M2 suggests consumers may pare back their spending, which wouldn’t be good news for the U.S. economy.
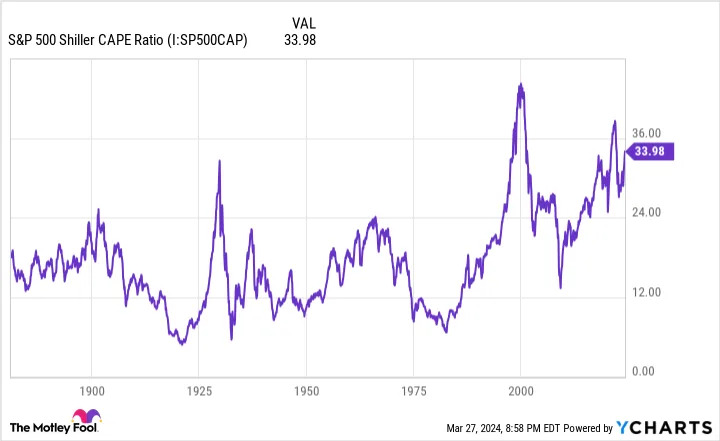
There have only been six instances since 1871 where the Shiller P/E ratio has topped and sustained 30 during a bull market. The previous five instances were all eventually (key word) followed by a decline of at least 20% in the S&P 500 and/or Dow Jones Industrial Average. While it’s not a timing tool, it does serve as a warning that extended valuations don’t last forever.
Based on this combination of macro factors and the unknowns of Trump’s policy proposals, a plunge in stocks isn’t out of the question if he wins a second term. Thankfully, history is a two-sided coin that undeniably favors the optimistic and patient.

Here’s what history says happens to stocks when Republicans win the presidency
If there’s a silver lining for investors as we head into the heart of election season, it’s that both parties have overseen some pretty hearty gains in the Oval Office.
Based on an analysis from independent financial intelligence firm CFRA Research in 2020 (i.e., while Trump was still in office), the S&P 500 has gained an average of 6.9% since 1945 with Republican presidents in the White House. On the flipside, the S&P 500 has risen by an average of 11.2% when Democrat presidents were in the Oval Office.
Though the stock market struggled under the tenure of a couple Republican presidents, including George W. Bush and Richard Nixon — the S&P 500 declined by an annual average of 5.6% and 3.9% during their respective presidencies — there are quite a few Republican presidents that oversaw sizable gains during their time in the White House. The gains under Donald Trump happen to be toward the top of the list, with Republican Calvin Coolidge overseeing the most robust annualized performance of any president over the past century (26.1% during a 5-1/2 year stretch in the Roaring Twenties).
Regardless of which president finds themselves in the White House, a copious amount of data suggests long-term-minded investors are going to be positioned for success.
One of the primary reasons patient investors tend to make money regardless of which political party is in charge is because of the economic cycle.
While recessions are a normal aspect of the economic cycle, downturns tend to come and go rather quickly. Since the end of World War II in 1945, there have been a dozen recessions in the United States. Out of these 12 downturns, nine resolved in under a year and none of the remaining three surpassed 18 months.
Comparatively, two periods of growth since 1945 surpassed the 10-year mark. The U.S. economy spends a disproportionate amount of time expanding, which is great news for any president in office, as well as for corporate America.
What’s most important is recognizing that the stock market spends a considerable portion of its time rising, too. Although the U.S. economy and equities aren’t linked at the hip, a growing economy pushes corporate earnings higher over time. These higher earnings are what allow valuations to expand.
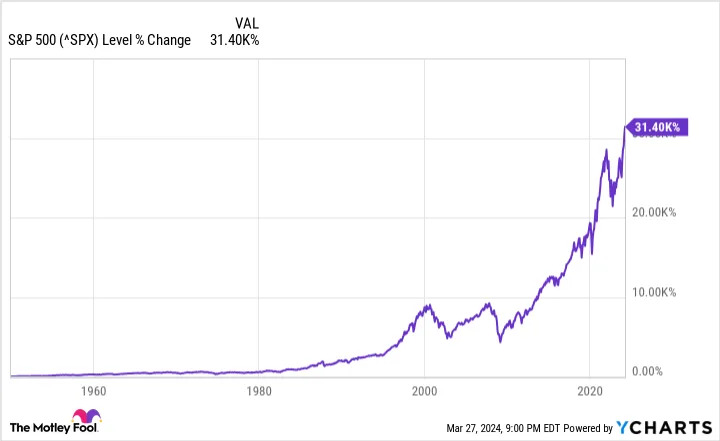
Last June, the analysts at investment insights company Bespoke Investment Group examined the average length of bear and bull markets in the S&P 500 since the start of the Great Depression in September 1929. The 1,011 calendar days the average S&P 500 bull market has lasted absolutely run circles around the average S&P 500 bear market length of 286 calendar days.
Though it’s virtually impossible to predict when short-term corrections and plunges will occur on Wall Street, there’s little concern that long-term investors will be just fine if Donald Trump wins a second term as president.
Where to invest $1,000 right now
When our analyst team has a stock tip, it can pay to listen. After all, the newsletter they have run for over a decade, Motley Fool Stock Advisor, has nearly tripled the market.*
Originally published by The Motley Fool on March 31, 2024 edition.


